How Long Will World Energy Reserve Last
To work out how long the energy resource will last, a simple calculation ignores the fact that the dwindling of proven reserves will help restore the balance and the demand will most likely still increase with time. Besides, the fact that a shortage of one resource will make people use its alternatives, reducing the durability of those alternatives
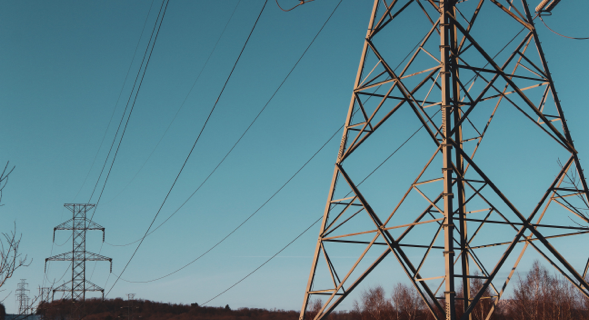
There are three major types of energy usage: heating, transportation and electricity. Our way of life has meant that electricity consumption has been increasing faster than overall energy consumption.
The development of human civilisation has always been associated with an increase in energy consumption, and that energy consumption will continue to increase.
| Coal (ktoe) | Natural Gas (ktoe) | Nuclear (ktoe) | Hydro (ktoe) | Wind, Solar, etc. (ktoe) | Biofuels and waste (ktoe) | Oil (ktoe) | |
|---|---|---|---|---|---|---|---|
| 1990 | 2,220,587 | 1,662,187 | 525,520 | 184,064 | 36,571 | 904,162 | 3,233,212 |
| 1995 | 2,207,669 | 1,806,624 | 608,098 | 212,766 | 42,391 | 967,469 | 3,373,297 |
| 2000 | 2,317,134 | 2,071,233 | 675,467 | 224,663 | 60,262 | 1,014,659 | 3,669,477 |
| 2005 | 2,990,601 | 2,360,022 | 721,706 | 252,334 | 70,143 | 1,088,960 | 4,010,067 |
| 2010 | 3,649,798 | 2,735,952 | 718,713 | 296,474 | 110,200 | 1,205,287 | 4,127,360 |
| 2015 | 3,842,742 | 2,928,795 | 670,172 | 334,851 | 203,821 | 1,271,235 | 4,328,233 |
| 2018 | 3,838,326 | 3,261,595 | 706,814 | 362,332 | 286,377 | 1,327,127 | 4,496,998 |
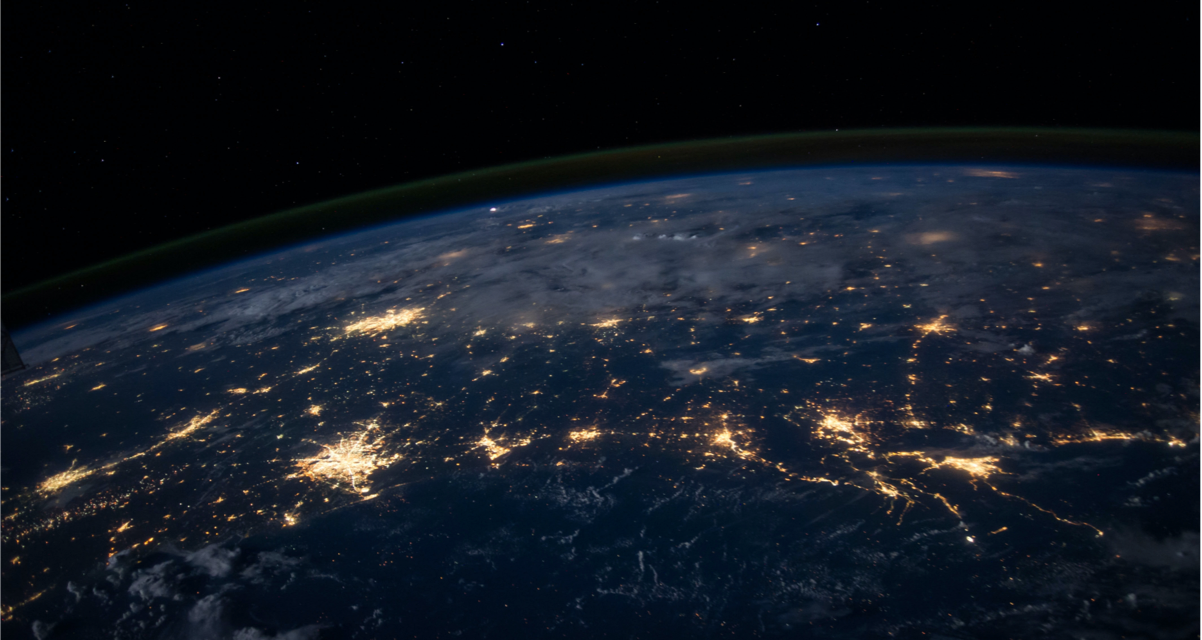
Fossil fuels dominate in supplying our energy needs. Oil and gas have lower shares in electricity generation than in energy consumption because they are also used for heating and transportation. By contrast, nuclear energy and hydropower are almost exclusively used for electricity generation.
Electricity generation around the world is heavily dependent on non-renewable energy, which contributes 70% of total generation, of which 61% comes from fossil fuels and 10% from nuclear sources. The remaining 27% comes from renewable energy, comprising of 16% from hydropower and some 1% from other renewable energy sources.
Fossil fuel 61.3%
Non-renewable 71.4%
Renewable 27.7%
Source: BP statistical review of world energy 2021
The availability of an energy resource is usually measured by the proven reserves and resources. The situation is of particular relevance for non-renewable energy. Renewable energy is by definition sustainable, so that its use is largely limited by the cost of installing suitable equipment at available sites while balancing other needs such as other land use or preserving natural environment.
Proven oil and gas reserves has been steadily increasing
Both proven reserves and resources depend very much on market conditions, which drive prices and exploration efforts. An increase in demand for oil, for example, will make more oil becoming economical to extract and drive technological development for oil extraction, so increasing the amount of proven reserves. The demand increase will also drive oil exploration efforts so increasing both proven reserves and resources for oil, so long as they remain small compared to the quantity that is still unknown and left unexplored. Such has been the situation historically with oil and gas and despite occasional concerns over possible shortages, the amount of proven oil and gas reserves has been steadily increasing over the last two decades.
Read More About Nuclear Essential